Please note that due to market volatility, some of the key levels may have already been reached and scenarios played out.


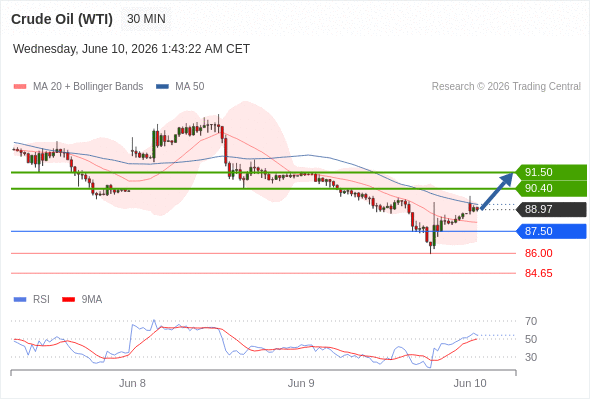
Crude Oil (WTI)‎ (N6)‎ intraday: towards 91.50.
 
Pivot:
87.50
 
Our preference:
Long positions above 87.50 with targets at 90.40 & 91.50 in extension.
 
Alternative scenario:
Below 87.50 look for further downside with 86.00 & 84.65 as targets.
 
Comment:
The RSI calls for a bounce.
 
Analyst Views Chart


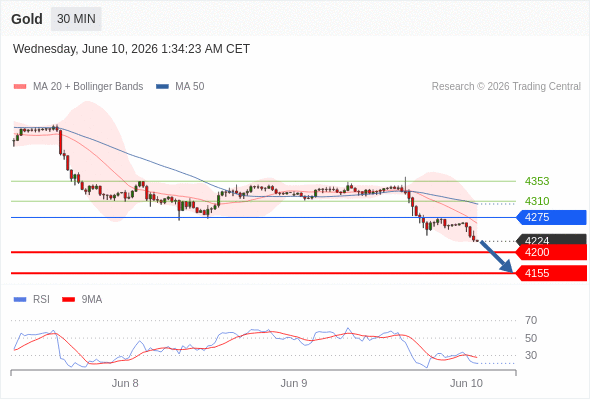
Gold intraday: under pressure.
 
Pivot:
4275
 
Our preference:
Short positions below 4275 with targets at 4200 & 4155 in extension.
 
Alternative scenario:
Above 4275 look for further upside with 4310 & 4353 as targets.
 
Comment:
The RSI has broken down its 30 level.
 
Analyst Views Chart


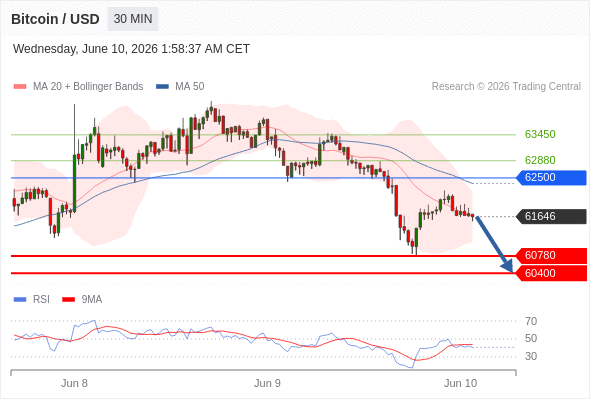
Bitcoin / USD intraday: the downside prevails.
 
Pivot:
62500
 
Our preference:
Short positions below 62500 with targets at 60780 & 60400 in extension.
 
Alternative scenario:
Above 62500 look for further upside with 62880 & 63450 as targets.
 
Comment:
As long as the resistance at 62500 is not surpassed, the risk of the break below 60780 remains high.
 
Analyst Views Chart


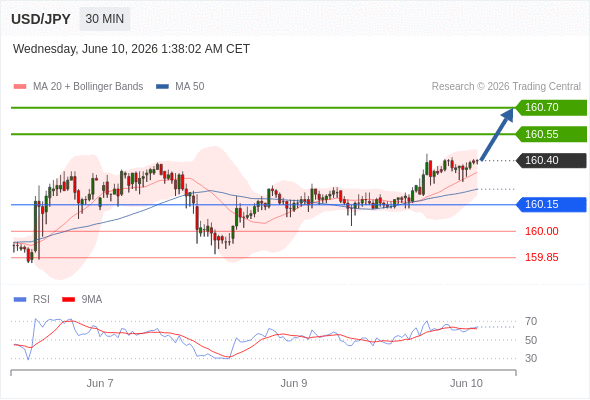
USD/JPY intraday: further advance.
 
Pivot:
160.15
 
Our preference:
Long positions above 160.15 with targets at 160.55 & 160.70 in extension.
 
Alternative scenario:
Below 160.15 look for further downside with 160.00 & 159.85 as targets.
 
Comment:
The RSI is bullish and calls for further upside.
 
Analyst Views Chart


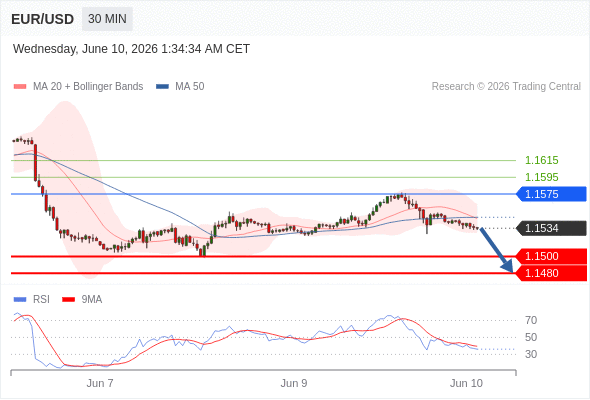
EUR/USD intraday: the downside prevails.
 
Pivot:
1.1575
 
Our preference:
Short positions below 1.1575 with targets at 1.1500 & 1.1480 in extension.
 
Alternative scenario:
Above 1.1575 look for further upside with 1.1595 & 1.1615 as targets.
 
Comment:
The RSI is bearish and calls for further downside.
 
Analyst Views Chart


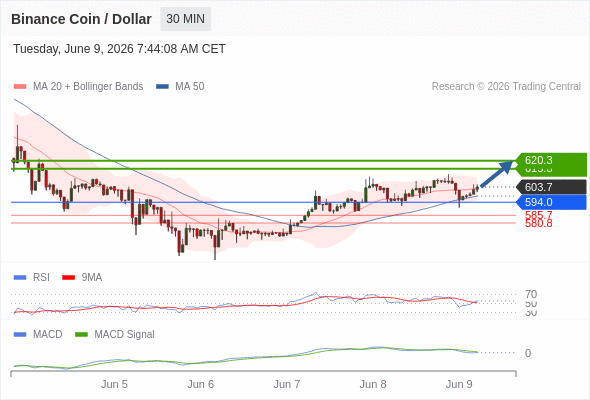
Binance Coin / Dollar intraday: as long as 594 is support look for 620.3
 
Our pivot point stands at 594.0.
 
Our preference:
As long as 594 is support look for 620.3.
 
Alternative scenario:
The downside breakout of 594 would call for 585.7 and 580.8.
 
Comment:
The RSI is above 50. The MACD is below its signal line and positive. The price could retrace. Moreover, the price is trading above both its 20 and 50 period moving average (respectively at 602.7 and 597.9).
 
Analyst Views Chart


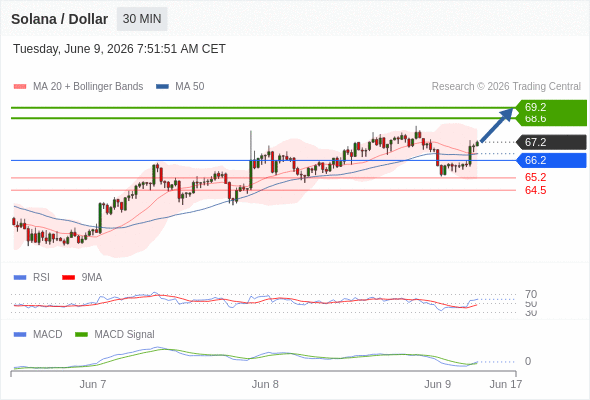
Solana / Dollar intraday: our next up target stands at 69.2
 
Our pivot point stands at 66.2.
 
Our preference:
Our next up target stands at 69.2.
 
Alternative scenario:
Below 66.2, expect 65.2 and 64.5.
 
Comment:
The RSI is above its neutrality area at 50. The MACD is above its signal line and negative. The MACD must break above its zero level to call for further upside. Moreover, the price is above its 20 and 50 period moving average (respectively at 66.6 and 66.6).
 
Analyst Views Chart