Please note that due to market volatility, some of the key levels may have already been reached and scenarios played out.


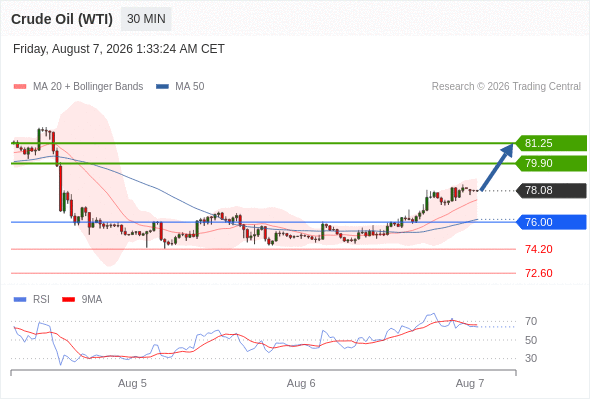
Crude Oil (WTI)‎ (U6)‎ intraday: 81.25 expected.
 
Pivot:
76.00
 
Our preference:
Long positions above 76.00 with targets at 79.90 & 81.25 in extension.
 
Alternative scenario:
Below 76.00 look for further downside with 74.20 & 72.60 as targets.
 
Comment:
The RSI is bullish and calls for further upside.
 
Analyst Views Chart


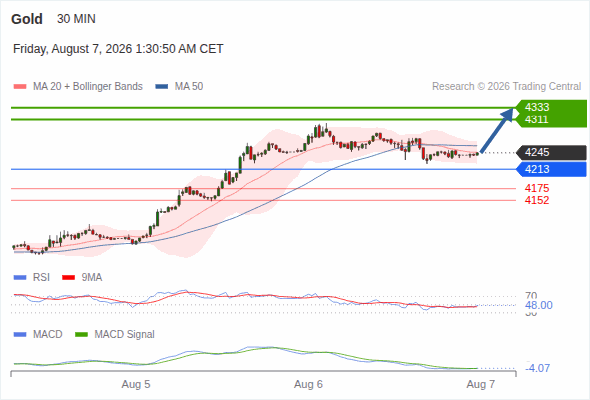
Gold intraday : Watch 4,311
 
Our pivot point is at 4,213.
 
Our preference:
The upside prevails as long as 4,213 is support, with 4,311 and 4,333 as targets
 
Alternative scenario:
Below 4,213, expect 4,175 and 4,152.
 
Comment:
The technical picture suggests holding the setup and awaiting price action.
 
Analyst Views Chart


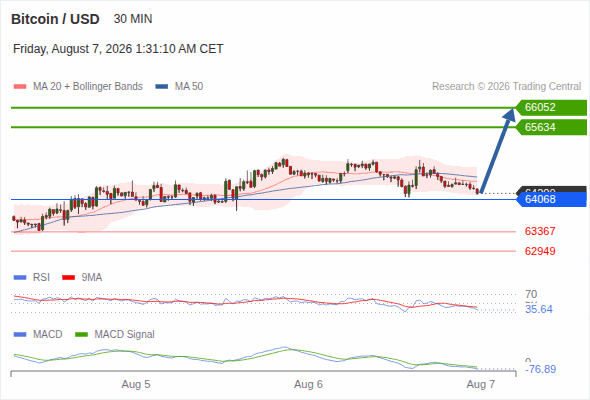
Bitcoin / USD intraday : On the edge of pivot level
 
Our pivot point is at 64,068.
 
Our preference:
The upside prevails as long as 64,068 is support, with 65,634 and 66,052 as targets
 
Alternative scenario:
Below 64,068, expect 63,367 and 62,949.
 
Comment:
The asset is now hovering dangerously close to our pivot, representing a pivotal moment that could be among the last opportunities for a trend reversal.
 
Analyst Views Chart


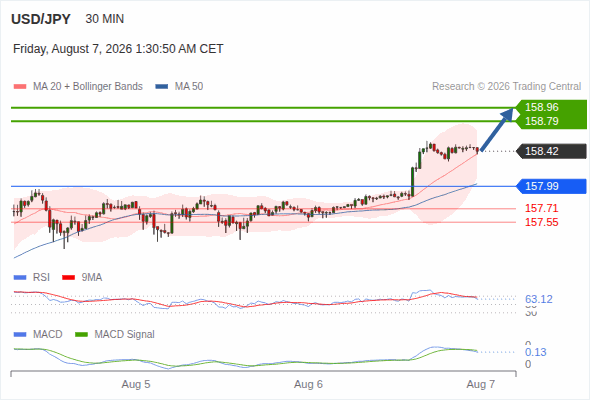
USD/JPY intraday : 158.79 in sight
 
Our pivot point is at 157.99.
 
Our preference:
The upside prevails as long as 157.99 is support, with 158.79 and 158.96 as targets
 
Alternative scenario:
Below 157.99, expect 157.71 and 157.55.
 
Comment:
The RSI is above its neutrality area at 50. The MACD is below its signal line and positive. The price is above its 20 and 50 period moving average (respectively at 158.39 and 158.02).
 
Analyst Views Chart


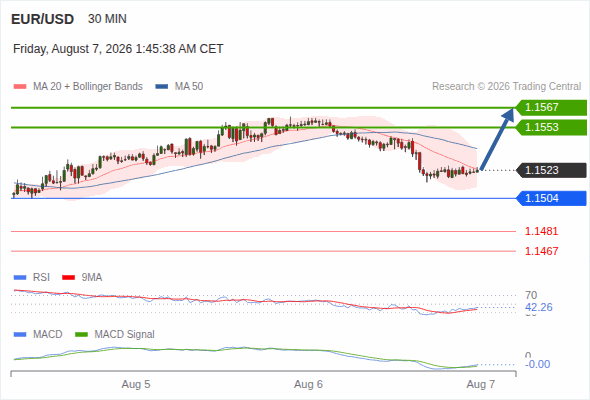
EUR/USD intraday : Expect 1.1553
 
Our pivot point is at 1.1504.
 
Our preference:
Rebound towards 1.1567
 
Alternative scenario:
Below 1.1504, expect 1.1481 and 1.1467.
 
Comment:
The next trend direction will be confirmed by key price levels.
 
Analyst Views Chart


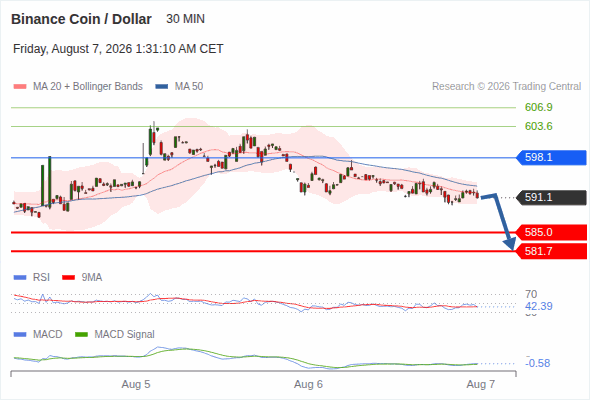
Binance Coin / Dollar intraday : Watch 585.0
 
Our pivot point is at 598.1.
 
Our preference:
The downside prevails as long as 598.1 is resistance, with 585.0 and 581.7 as targets
 
Alternative scenario:
Above 598.1, look for 603.6 and 606.9.
 
Comment:
The RSI is below its neutrality area at 50. The MACD is above its signal line and negative. The price stands below its 20 and 50 period moving average (respectively at 592.0 and 593.1).
 
Analyst Views Chart


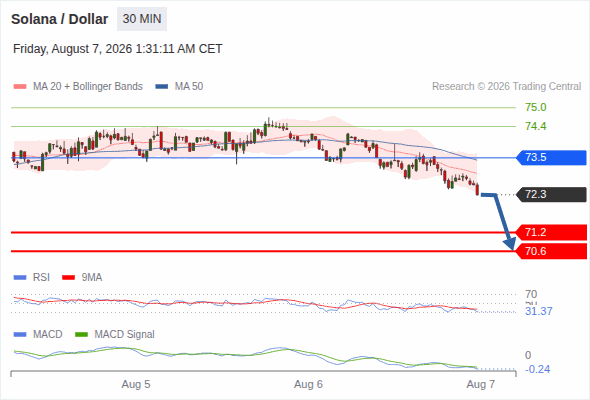
Solana / Dollar intraday : The downside prevails as long as 73.5 is resistance
 
Our pivot point is at 73.5.
 
Our preference:
The downside prevails as long as 73.5 is resistance, with 71.2 and 70.6 as targets
 
Alternative scenario:
Above 73.5, look for 74.4 and 75.0.
 
Comment:
The RSI is below its neutrality area at 50. The MACD is below its signal line and negative. The configuration is negative. The price stands below its 20 and 50 period moving average (respectively at 73.0 and 73.4). The Solana / Dollar is trading below its lower Bollinger band (standing at 72.3).
 
Analyst Views Chart