Please note that due to market volatility, some of the key levels may have already been reached and scenarios played out.


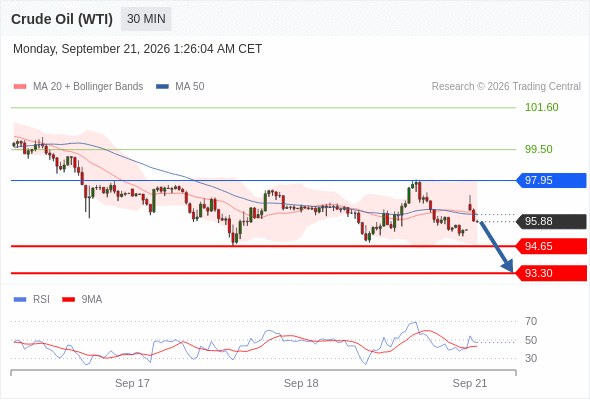
Crude Oil (WTI)‎ (X6)‎ intraday: choppy.
 
Pivot:
97.95
 
Our preference:
Short positions below 97.95 with targets at 94.65 & 93.30 in extension.
 
Alternative scenario:
Above 97.95 look for further upside with 99.50 & 101.60 as targets.
 
Comment:
A break below 94.65 would trigger a drop towards 93.30.
 
Analyst Views Chart


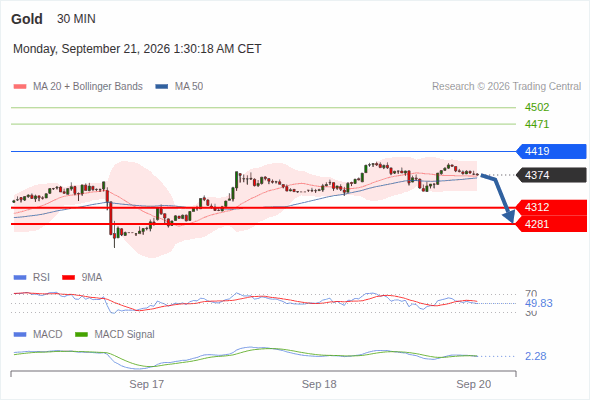
Gold intraday : Target 4,281
 
Our pivot point is at 4,419.
 
Our preference:
In spite of the current rebound, our pivot threshold at 4,419 has not been hit and our target remains 4,281
 
Alternative scenario:
Above 4,419, look for 4,471 and 4,502.
 
Comment:
The RSI is below its neutrality area at 50. The MACD is below its signal line and positive. The MACD must penetrate its zero line to expect further downside. The price is above its 20 and 50 period moving average (respectively at 4,372 and 4,369).
 
Analyst Views Chart


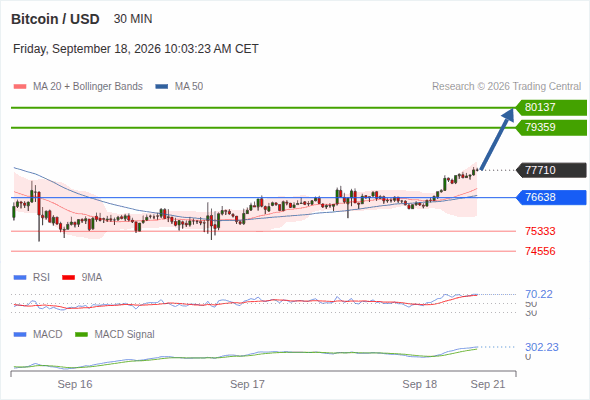
Bitcoin / USD intraday : The upside prevails as long as 76,638 is support
 
Our pivot point is at 76,638.
 
Our preference:
The upside prevails as long as 76,638 is support, with 79,359 and 80,137 as targets
 
Alternative scenario:
Below 76,638, expect 75,333 and 74,556.
 
Comment:
The RSI is above 70. It could mean either that the price is in a lasting uptrend or just overbought and therefore bound to correct (look for bearish divergence in this case). The MACD is above its signal line and positive. The configuration is positive. The price is above its 20 and 50 period moving average (respectively at 77,002 and 76,727).
 
Analyst Views Chart


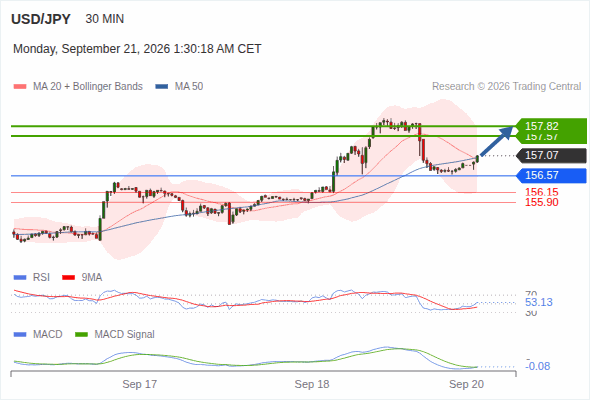
USD/JPY intraday : Our next up target stands at 157.82
 
Our pivot point is at 156.57.
 
Our preference:
Our technical view is bullish above 156.57 with targets at 157.57 & 157.82
 
Alternative scenario:
Below 156.57, expect 156.15 and 155.90.
 
Comment:
The RSI is above its neutrality area at 50. The MACD is above its signal line and negative. The MACD must break above its zero level to trigger further gains. The price is above its 20 and 50 period moving average (respectively at 156.99 and 157.03).
 
Analyst Views Chart


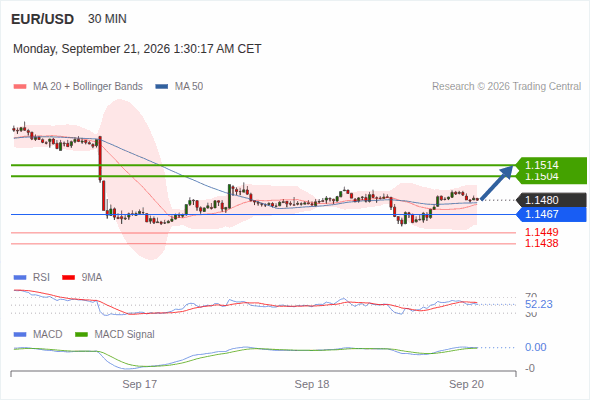
EUR/USD intraday : The upside prevails as long as 1.1467 is support
 
Our pivot point is at 1.1467.
 
Our preference:
The upside prevails as long as 1.1467 is support, with 1.1504 and 1.1514 as targets
 
Alternative scenario:
Below 1.1467, expect 1.1449 and 1.1438.
 
Comment:
The RSI is above its neutrality area at 50. The MACD is above its signal line and positive. The configuration is positive. The price is above its 20 and 50 period moving average (respectively at 1.1476 and 1.1478).
 
Analyst Views Chart


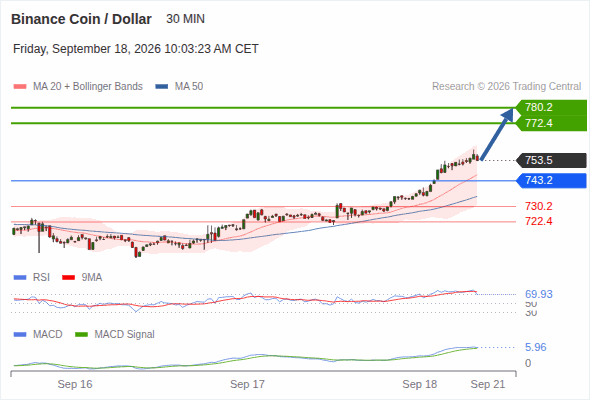
Binance Coin / Dollar intraday : The upside prevails as long as 743.2 is support
 
Our pivot point is at 743.2.
 
Our preference:
The upside prevails as long as 743.2 is support, with 772.4 and 780.2 as targets
 
Alternative scenario:
Below 743.2, expect 730.2 and 722.4.
 
Comment:
The RSI is above its neutrality area at 50. The MACD is above its signal line and positive. The configuration is positive. The price is above its 20 and 50 period moving average (respectively at 746.2 and 735.3).
 
Analyst Views Chart


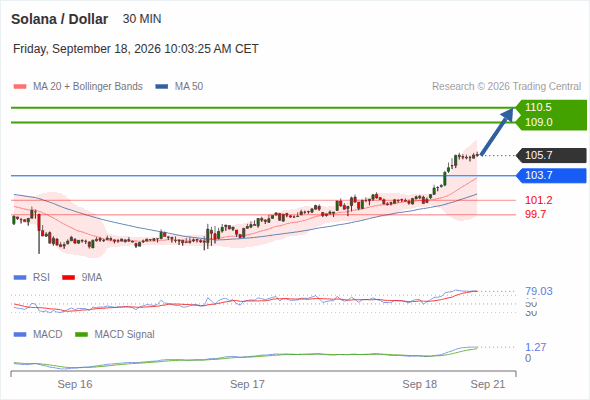
Solana / Dollar intraday : the RSI is overbought
 
Our pivot point is at 103.7.
 
Our preference:
The upside prevails as long as 103.7 is support, with 109.0 and 110.5 as targets
 
Alternative scenario:
Below 103.7, expect 101.2 and 99.7.
 
Comment:
The RSI is above 70. It could mean either that the price is in a lasting uptrend or just overbought and therefore bound to correct (look for bearish divergence in this case). The MACD is above its signal line and positive. The configuration is positive. The price is above its 20 and 50 period moving average (respectively at 103.5 and 101.8).
 
Analyst Views Chart