Please note that due to market volatility, some of the key levels may have already been reached and scenarios played out.


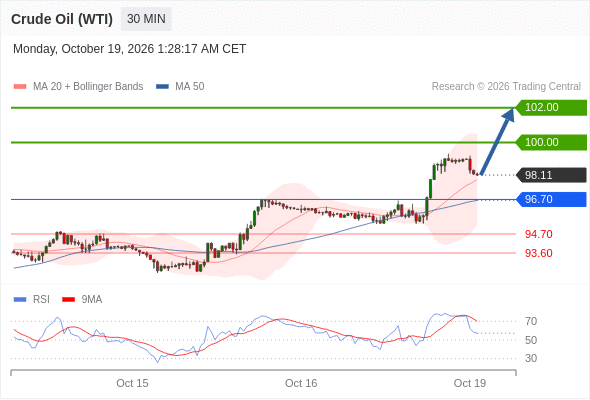
Crude Oil (WTI)‎ (Z6)‎ intraday: intraday support around 96.70.
 
Pivot:
96.70
 
Our preference:
Long positions above 96.70 with targets at 100.00 & 102.00 in extension.
 
Alternative scenario:
Below 96.70 look for further downside with 94.70 & 93.60 as targets.
 
Comment:
The RSI is above its neutrality area at 50%.
 
Analyst Views Chart


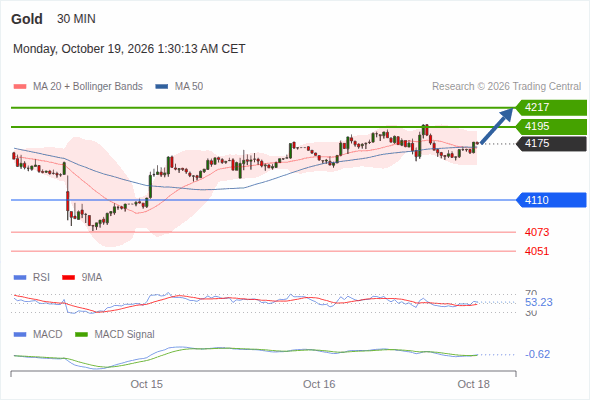
Gold intraday : Watching for a Trigger Above Resistance
 
Our pivot point is at 4,110.
 
Our preference:
The upside prevails as long as 4,110 is support, with 4,195 and 4,217 as targets
 
Alternative scenario:
Below 4,110, expect 4,073 and 4,051.
 
Comment:
Prices are now within reach of our first target, a level that could invite the price to consolidate. On the flip side, a clear break above it may well sustain the upward move.
 
Analyst Views Chart


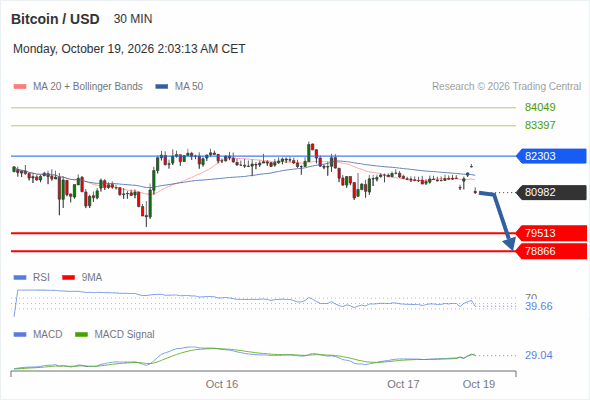
Bitcoin / USD intraday : 79,513 expected
 
Our pivot point is at 82,303.
 
Our preference:
The downside prevails as long as 82,303 is resistance, with 79,513 and 78,866 as targets
 
Alternative scenario:
Above 82,303, look for 83,397 and 84,049.
 
Comment:
The RSI is below its neutrality area at 50. The price stands below its 20 and 50 period moving average (respectively at 81,445 and 81,611). The Bitcoin / USD is trading below its lower Bollinger band (standing at 81,086).
 
Analyst Views Chart


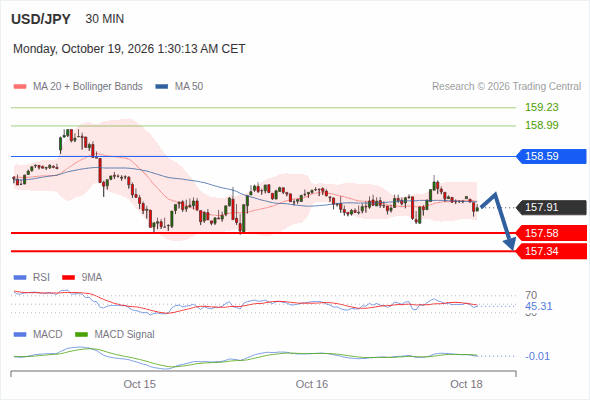
USD/JPY intraday : Rebound or deeper decline ahead?
 
Our pivot point is at 158.59.
 
Our preference:
Under pressure below 158.59, with 157.58 and 157.34 as targets
 
Alternative scenario:
Above 158.59, look for 158.99 and 159.23.
 
Comment:
The approach toward our first target represents a key level to monitor, it may trigger pressure for a pullback, though a firm close below this threshold could lead prices lower.
 
Analyst Views Chart


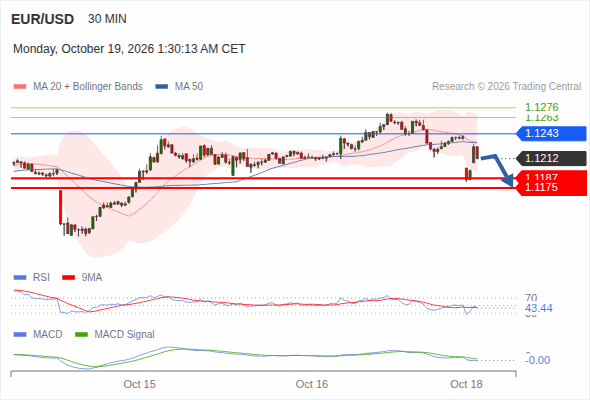
EUR/USD intraday : The downside prevails as long as 1.1243 is resistance
 
Our pivot point is at 1.1243.
 
Our preference:
The downside prevails as long as 1.1243 is resistance, with 1.1187 and 1.1175 as targets
 
Alternative scenario:
Above 1.1243, look for 1.1263 and 1.1276.
 
Comment:
The RSI is below its neutrality area at 50. The MACD is below its signal line and negative. The configuration is negative. The price stands below its 20 and 50 period moving average (respectively at 1.1231 and 1.1232).
 
Analyst Views Chart


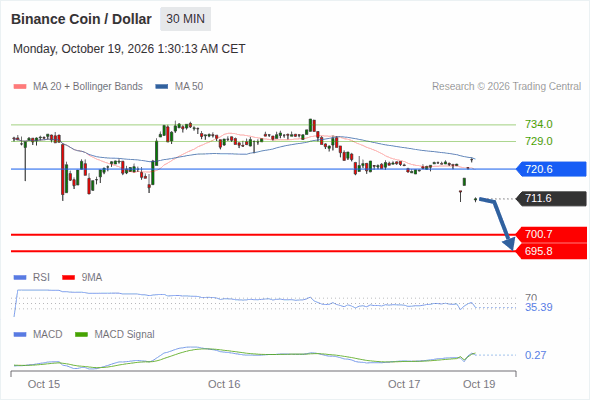
Binance Coin / Dollar intraday : 700.7 expected
 
Our pivot point is at 720.6.
 
Our preference:
The downside prevails as long as 720.6 is resistance, with 700.7 and 695.8 as targets
 
Alternative scenario:
Above 720.6, look for 729.0 and 734.0.
 
Comment:
The RSI is below its neutrality area at 50. The price stands below its 20 and 50 period moving average (respectively at 720.5 and 723.7). The Binance Coin / Dollar is trading below its lower Bollinger band (standing at 714.5).
 
Analyst Views Chart


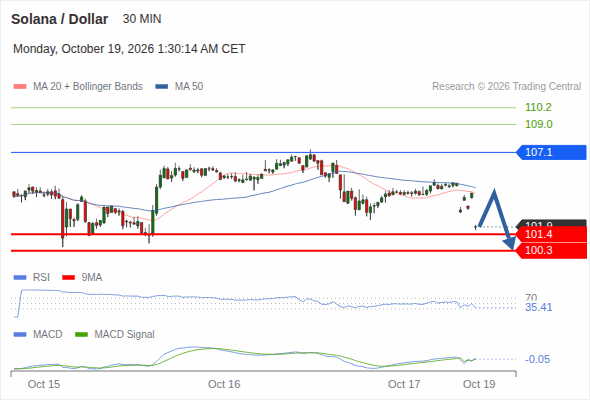
Solana / Dollar intraday : Decline at a crossroads
 
Our pivot point is at 107.1.
 
Our preference:
The downside prevails as long as 107.1 is resistance, with 101.4 and 100.3 as targets
 
Alternative scenario:
Above 107.1, look for 109.0 and 110.2.
 
Comment:
The approach toward our first target represents a key level to monitor, it may trigger pressure for a pullback, though a firm close below this threshold could lead prices lower.
 
Analyst Views Chart